
Conversion Impact Score: What is it? And why do you need to know yours?
By Tammy Everts
From a user experience perspective, in an ideal world every page would load in less than a second, we’d zip through a transaction in moments, and boom, we’d be done.
But as I’ve written about in the past, not all web pages are created equal. People react differently to slowdowns on different pages in the conversion funnel, which means you need to approach each page differently. While it would be wonderful if we could optimize every single page of our websites, most site owners have only a finite amount of optimization resources. You need to focus those resources on optimizing the pages that matter most to your bottom line.
In this post, I’m going to explain how to determine which pages you should focus on optimizing in order to increase conversions and, ultimately, deliver the fastest ROI.
First: What does “conversion” mean?
There’s a widely held belief that the only people who need to care about conversions are people in sales and business development. Wrong. Conversions are the lifeblood of your business. If you touch your company’s website in any way — be it design, marketing, or development — then your actions have an impact on conversions. You need to understand what that impact is.
But first, I have a tendency to drop terms like “conversion” and “conversion rate” without explaining what they mean, so let me slow down for a minute to offer some definitions.
Conversion = What happens when a person who’s browsing a site converts to being a user or buyer of the service or product that site offers.
So if you’re a SaaS vendor, a conversion happens when a person signs up to use your service. Or if you’re an ecommerce shop, when a person buys something. Conversions can also include actions like signing up for a newsletter or making a donation. You get the idea.
Conversion funnel = The start-to-finish path that a person takes when they convert from browsing to buying/downloading/etc.
A conversion funnel for an ecommerce site might look something like this (note that percentages are arbitrary):

Conversion rate: The percentage of total visits to a site that result in a conversion.
In the conversion funnel graphic above, the conversion rate is the number of people who completed a purchase: 10%. Note that 10% would be a wildly successful conversion rate. More typically, conversion rates are in the 2-4% range. Anything higher than that is amazing. For a site that does hundreds of thousands of dollars worth of transactions in a day, even tiny changes in conversion rate — such as increasing from 2.1% to 2.2% — can have a huge impact on revenue.
Performance slowdowns affect conversions differently on different pages
When pages get slower, conversion rates suffer. But some types of pages suffer more than others.
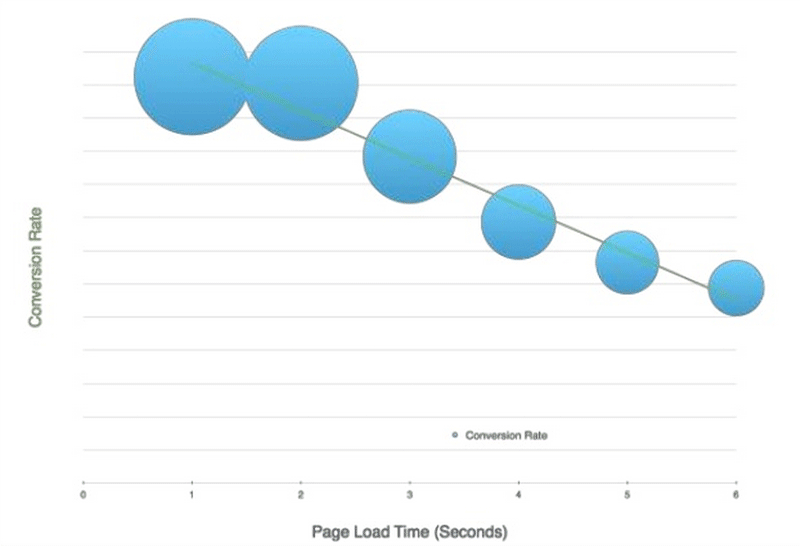
A while back, we looked at real-life performance data for one of our ecommerce customers who uses mPulse for real-user monitoring. We found that, while slower load times correlated to fewer conversions, the impact was most dramatic when pages in the “browsing” part of the conversion funnel were slower.
Here you can see that the conversion rate shrinks by about 50% when the load time for “browse” pages increases from 1 to 6 seconds:
Looking at the same set of user data, you can see that the impact on conversion rate is much less when checkout pages degrade in speed:
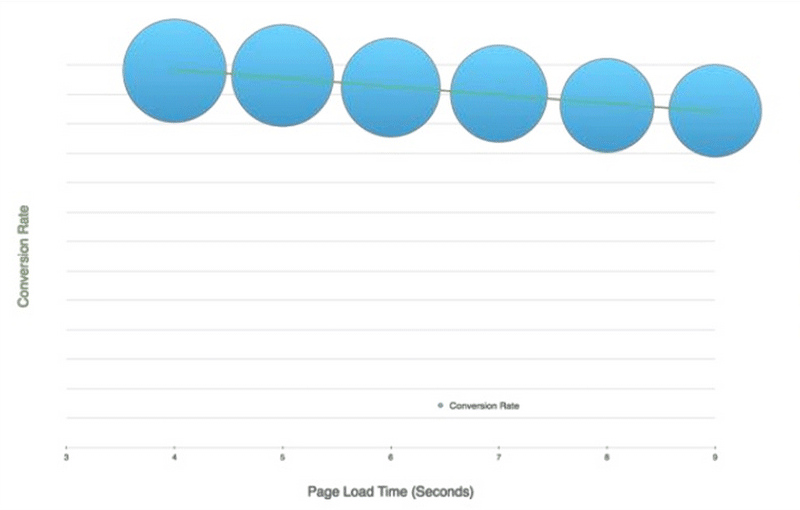
Looking at these two graphs side by side, you could be tempted to deduce that, because conversions were hurt more by slow “browse” pages than by slow “checkout” pages, the site owner should focus energy on optimizing the browse pages. This might be true — but it might not be true, too. This is where the Conversion Impact Score comes in.
What is the Conversion Impact Score?
The long definition:
The Conversion Impact Score (CIS) is a relative score that ranks page groups by their propensity to negatively impact conversions due to high load times. For each page group, the Conversion Impact Score is calculated using the proportion of overall requests that are associated with that group, along with the Spearman Ranked Correlation between its load times and number of conversions. The Conversion Impact Score will always be a number between -1 and 1, though scores much greater than zero should be very rare. The more negative the score, the more detrimental to conversions that high load times for that page group are, relative to the other page groups.
The TL;DR definition:
The Conversion Impact Score answers this question:
How much impact does the performance of this page have on conversions?
Case study: How to use Conversion Impact Scoring to prioritize performance optimization
Now let’s walk through how to use the Conversion Impact Score to make decisions about optimizing your pages.
In the graph below (which represents anonymized data from one of our mPulse customers), you can see the Conversion Impact Scores and load times for a set of pages on a site. The blue bars represent the Conversion Impact Score for each page, and the green line represents the median page load time for each page.
The pages are ranked from those with the highest Conversion Impact Scores (such as product and category pages; in other words, pages viewed in the “browse” phase of the conversion funnel) to pages with the lowest scores (such as sign-in and account pages).

Some quick observations:
- -The three fastest pages — Coupons, Pricing, and Circulars and Catalogs — all have relatively low Conversion Impact Scores, despite being very fast. This means that page speed isn’t a significant factor in how well these pages convert.
- -The pages with the best Conversion Impact Scores — such as Product and Category pages — have okay load times in the 4-second range.
- -The slowest page is the Order Billing page (in other words, a checkout page), followed by the Home page, Shopping Bag, and Order Review pages.
Without knowing the Conversion Impact Scores for these pages, you might focus on optimizing pages according to how slow they load.
Looking at load time, this is the order in which you’d prioritize fixing these pages:
- 1. Order Billing
- 2. Home
- 3. Shopping Bag
- 4. Product
- 5. Category
Now here’s how these assumptions are incorrect:
Mistake #1: Prioritizing the Order Billing page because it’s the slowest
If you looked only at page load times, you might believe that you need to prioritize the Order Billing page because its performance is dramatically poorer than the other pages. But if you knew its Conversion Impact Score, you’d realize that page speed doesn’t have much impact on conversion rate either way, so making this page faster wouldn’t be the best use of your limited optimization resources.
Mistake #2: Tackling the Shopping Bag and Home pages next
Also, if you were to look exclusively at load times, you might believe that when you’re done with optimizing the Order Billing page, you should focus next on addressing performance issues on the Shopping Bag and Home pages. While these pages have a high enough Conversion Impact Score that they merit addressing, they shouldn’t rank high up on your list.
Mistake #3: Not worrying about the Product and Category pages because they seem relatively fast
Still looking solely at load times, you might also guess that, because the Product and Category pages look fairly speedy, you don’t need to worry about them. This is where you’d make your biggest mistake. Because these pages have the highest Conversion Impact Scores, they have the potential to deliver the most benefit to you if you make them faster.
Conclusion
So, knowing the Conversion Impact Scores for this set of pages, this is the order in which you might actually want to prioritize their optimization to give you the best ROI:
- 1. Product
- 2. Category
- 3. Shopping Bag
- 4. Home
- 5. Order Billing (This is debatable. While improving the performance of this very slow page might not have much impact on conversions due to its low Conversion Impact Score, it would definitely improve the user experience at the tail end of the transaction — which is when people are most impressionable about their perception of an experience. Improving the final stage of the transaction could result in a higher degree of customer satisfaction, which could improve customer retention and word of mouth. This is all somewhat theoretical, but it has its basis in other research around performance and user experience.)
Takeaway
Knowing your pages’ load times is just one piece of the optimization puzzle. You need to correlate load time with other metrics, such as conversions or bounce rate, that are meaningful to your business, and you need to develop a tool — such as the Conversion Impact Score — that can weight your results so that you know what pages to tackle first to get the best ROI for your optimization efforts.
Tammy Everts has spent the past two decades obsessed with the many factors that go into creating the best possible user experience. As a senior researcher and evangelist at SOASTA, she researches the technical, business, and human aspects of web/application performance shares her findings via countless blog posts, presentations, case studies, articles, and reports.


