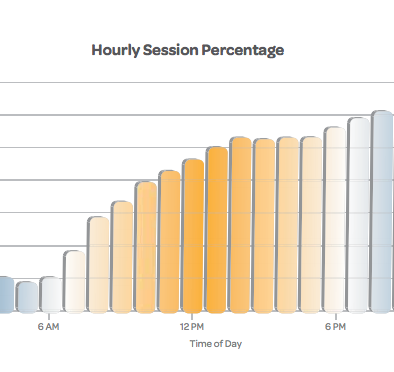
Mobile device users are spending more and more time on mobile apps, according to a new report from mobile app analytics firm Flurry. US consumers spent an average of 127 minutes on mobile apps per day, a gain of 35% year-over-year.
So how does mobile app usage compare to desktop web usage — or to the time spent watching TV? A comparison of Flurry’s mobile app data with web usage indicates that US consumers spend more time in apps than surfing the web via desktop. The average time spent (compiled using publicly available data from comScore and Alexa) on the web declined 2.4%, from 72 minutes to 70 minutes year-over-year.
The 127 minutes spent on mobile apps each day is also inching its way toward the 168 minutes spent watching TV per day, based on data from the United States Bureau of Labor Statistics for 2010 and 2011. Time spent in mobile apps now totals 76% of time spent watching television.
A significant portion of those 127 minutes belong to mobile gaming, which is responsible for 43% of time spent on mobile apps worldwide. Social networking accounts for 26% of consumers’ time on mobile apps, followed by entertainment and utility, each at 10%.
Do you spend more time on mobile apps or watching television? And which type of mobile apps consume more of your time?


